Annual Reports
Copart, Inc.'s annual reports contain management's most considered account of the business. These are the sections, passages and visual pages worth opening in the originals preserved in Sources.
Copart, Inc. — FY2025 Annual Report (Form 10-K) — FY2025 (year ended July 31, 2025)
Latest 10-K: management's fullest account of the salvage-auction model, its insurance-seller base, unit economics, and the risks that move volume. · Open the full document →
Item 1. Business — p. 4 · Read the full section →
Defines the model: an online marketplace (VB3) selling mostly-insurance salvage as agent, with principal buying only in a few markets.
Industry Overview — p. 8 · Read the full section →
Explains the demand engine — how insurers decide total-loss vs. repair, the swing factor behind salvage supply.
When repair cost exceeds PAV less salvage value, the car is totalled — and newer, complex cars total more often.
The adjuster determines whether to pay for repairs or to classify the vehicle as a total loss based upon the adjuster’s estimate of repair costs, vehicle’s salvage value, and the PAV, as well as customer service considerations. If the cost of repair is greater than the PAV less the estimated salvage value, the insurance company generally will classify the vehicle as a total loss. […] We believe that one effect of these additional features is that newer vehicles involved in accidents are more costly to repair and, accordingly, more likely to be deemed a total loss for insurance purposes.
p. 10 · Read in context →
Item 1A. Risk Factors — Storage facility capacity — p. 33 · Read the full section →
Capacity is physical land; zoning and permits can cap growth, and catastrophe surges (Helene, Milton) can overwhelm it.
Facility capacity varies by region; hurricanes filled lots and dented results — new land is hard to permit.
Capacity at our storage facilities varies from period to period and from region to region. […] For example, Hurricanes Helene and Milton had, in certain quarters, an adverse effect on our operating results, in part because of facility capacity constraints in the impacted areas of the U.S. […] We may not be able to reach agreements to purchase independent storage facilities in markets where we have limited excess capacity, zoning restrictions or difficulties obtaining and maintaining use permits, which may limit our ability to sustain and expand our capacity through acquisitions of new land.
p. 33 · Read in context →
Item 1A. Risk Factors — Subhaulers and trucking fleet — p. 36 · Read the full section →
Every car is towed; the model leans on independent subhaulers and owned trucks, exposing it to fuel costs it may not pass on.
Reliance on independent subhaulers across 11 countries; fuel-cost increases may not be passable to sellers or buyers.
We rely primarily upon independent subhaulers to pick up and deliver vehicles to and from our storage facilities in the U.S., Canada, Brazil, the Republic of Ireland, Germany, Finland, the U.A.E., Oman, Bahrain, and Spain. […] Further, an increase in fuel cost may lead to increased prices charged by our independent subhaulers, which may significantly increase our cost. We may not be able to pass these costs on to our sellers or buyers.
p. 36 · Read in context →
Item 1A. Risk Factors — Competition and seller concentration — p. 38 · Read the full section →
The supply side is the risk: few large sellers, no long-term contracts, and dismantlers that can bypass the auction entirely.
Limited number of sellers and absence of long-term contracts leave market share exposed to competitors.
We face significant competition for the supply of salvage and other vehicles and for the buyers of those vehicles. […] Due to the limited number of vehicle sellers, particularly in the U.K., and other foreign markets, the absence of long-term contractual commitments between us and our sellers and the increasingly competitive market environment, there can be no assurance that our competitors will not gain market share at our expense.
p. 38 · Read in context →
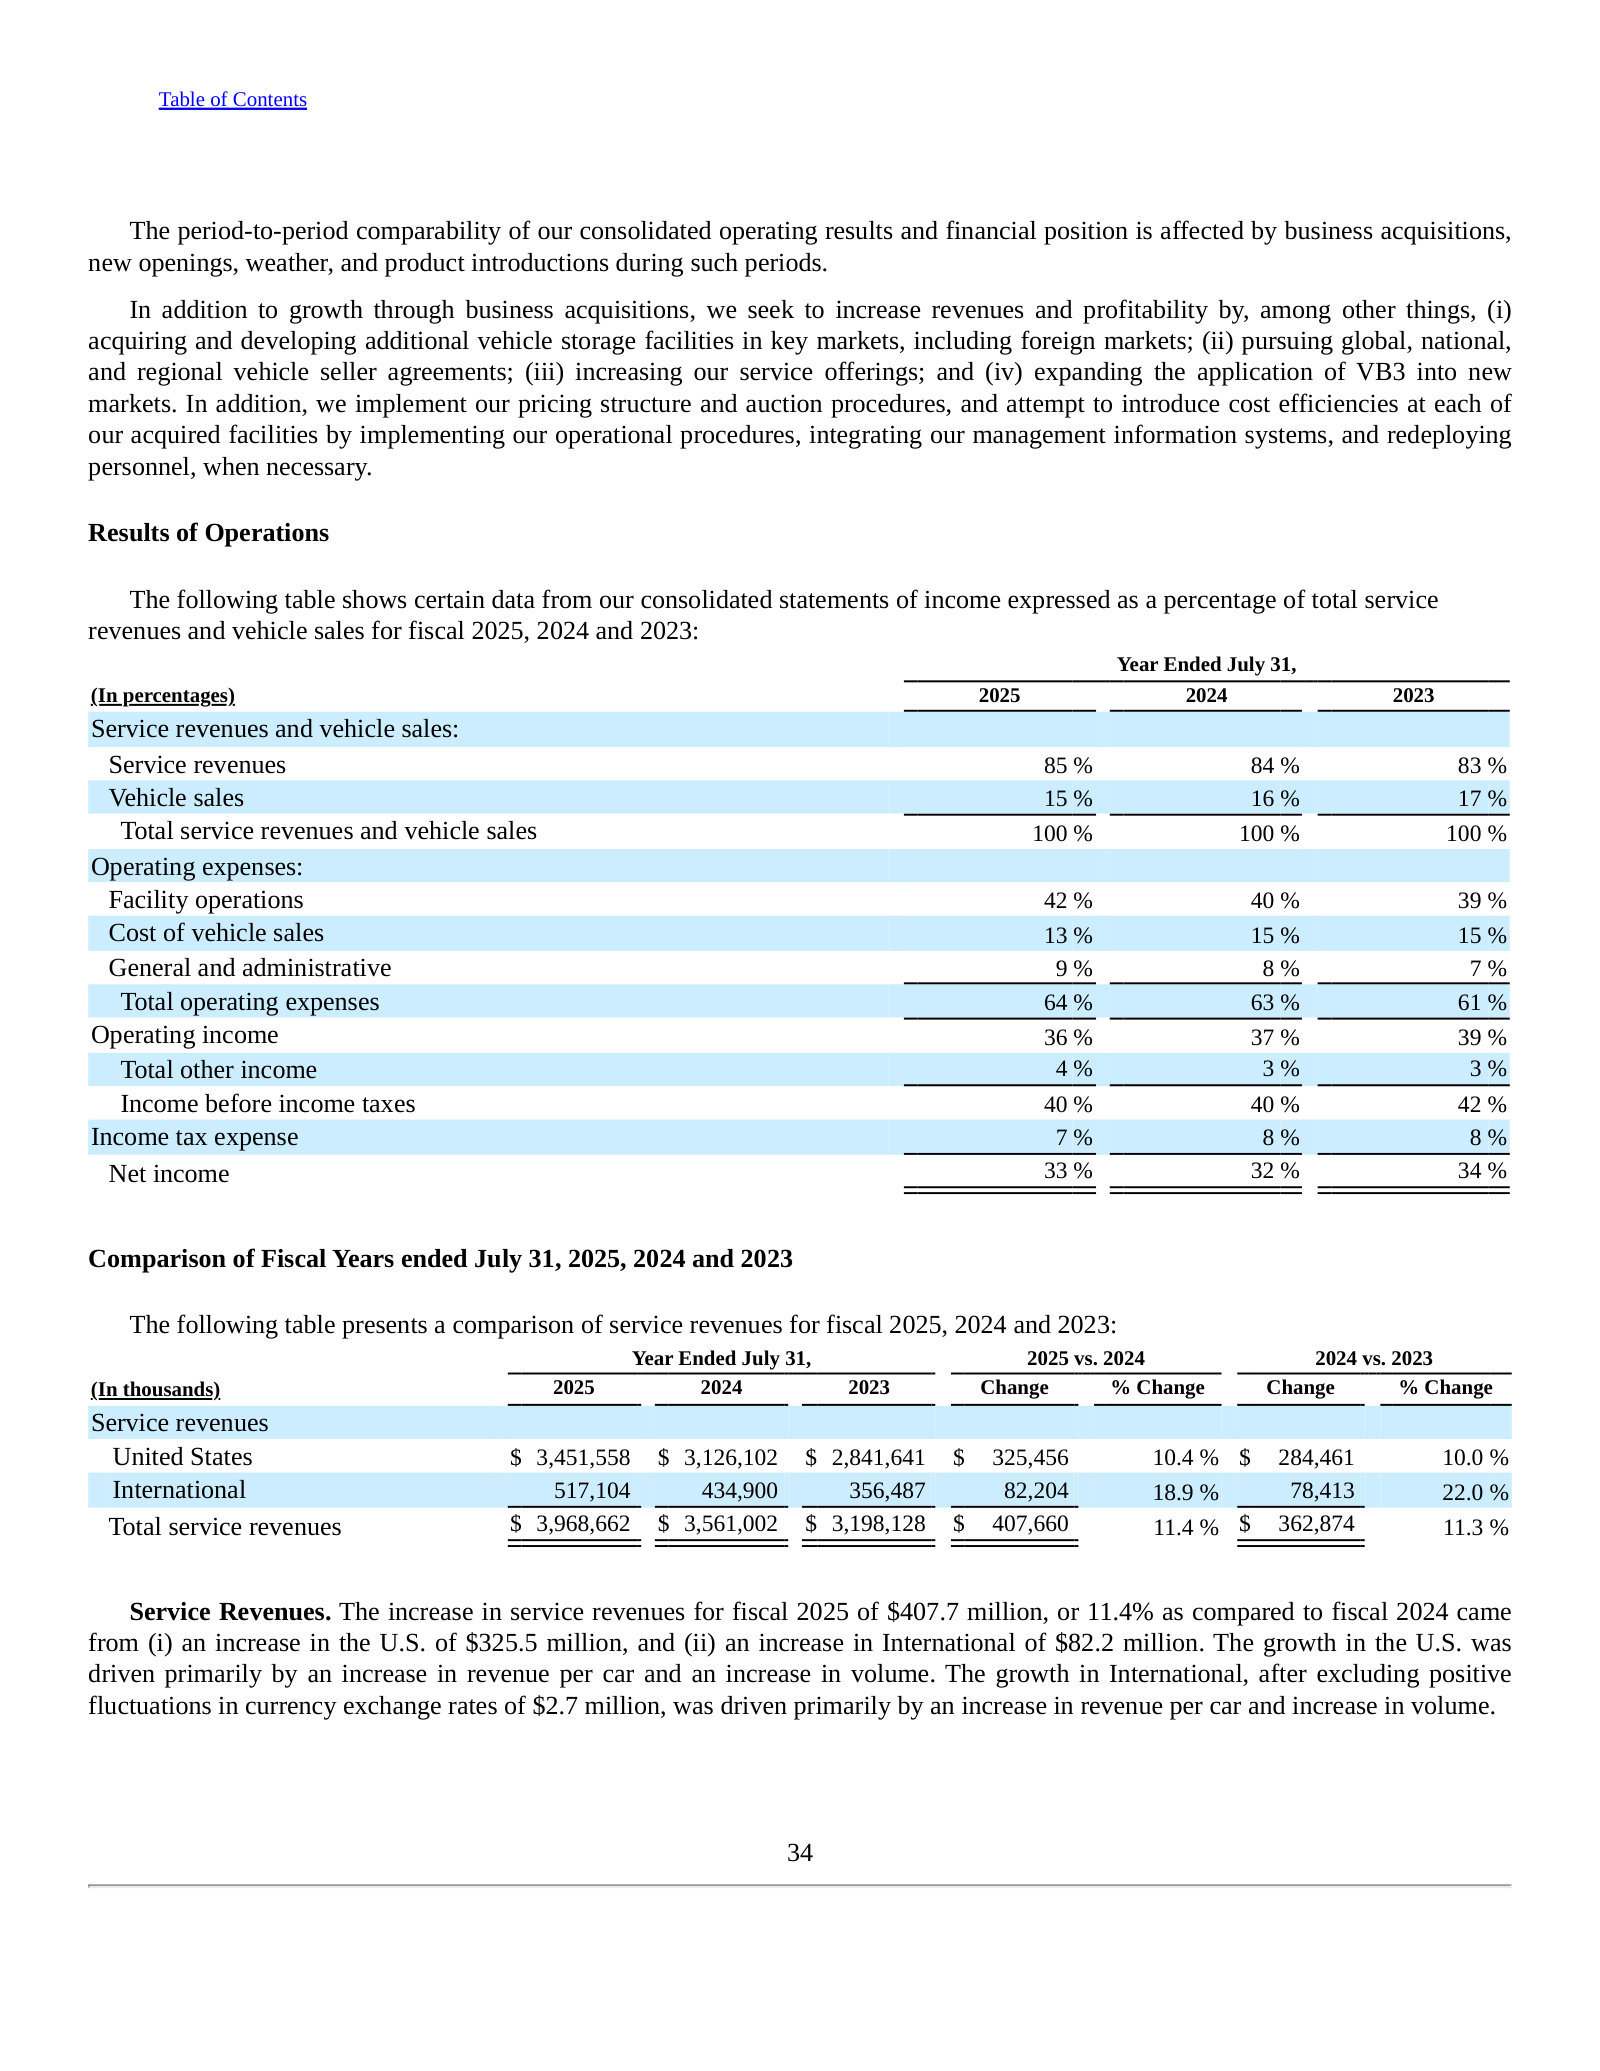
Item 7. Management's Discussion and Analysis — p. 58 · Read the full section →
Where management explains what drives revenue and how the operating margin actually stacks up across three years.
Critical Accounting Policies — Revenue Recognition — p. 72 · Read the full section →
The accounting is the business model: consignment fees booked net (service) vs. owned cars booked gross (vehicle sales).
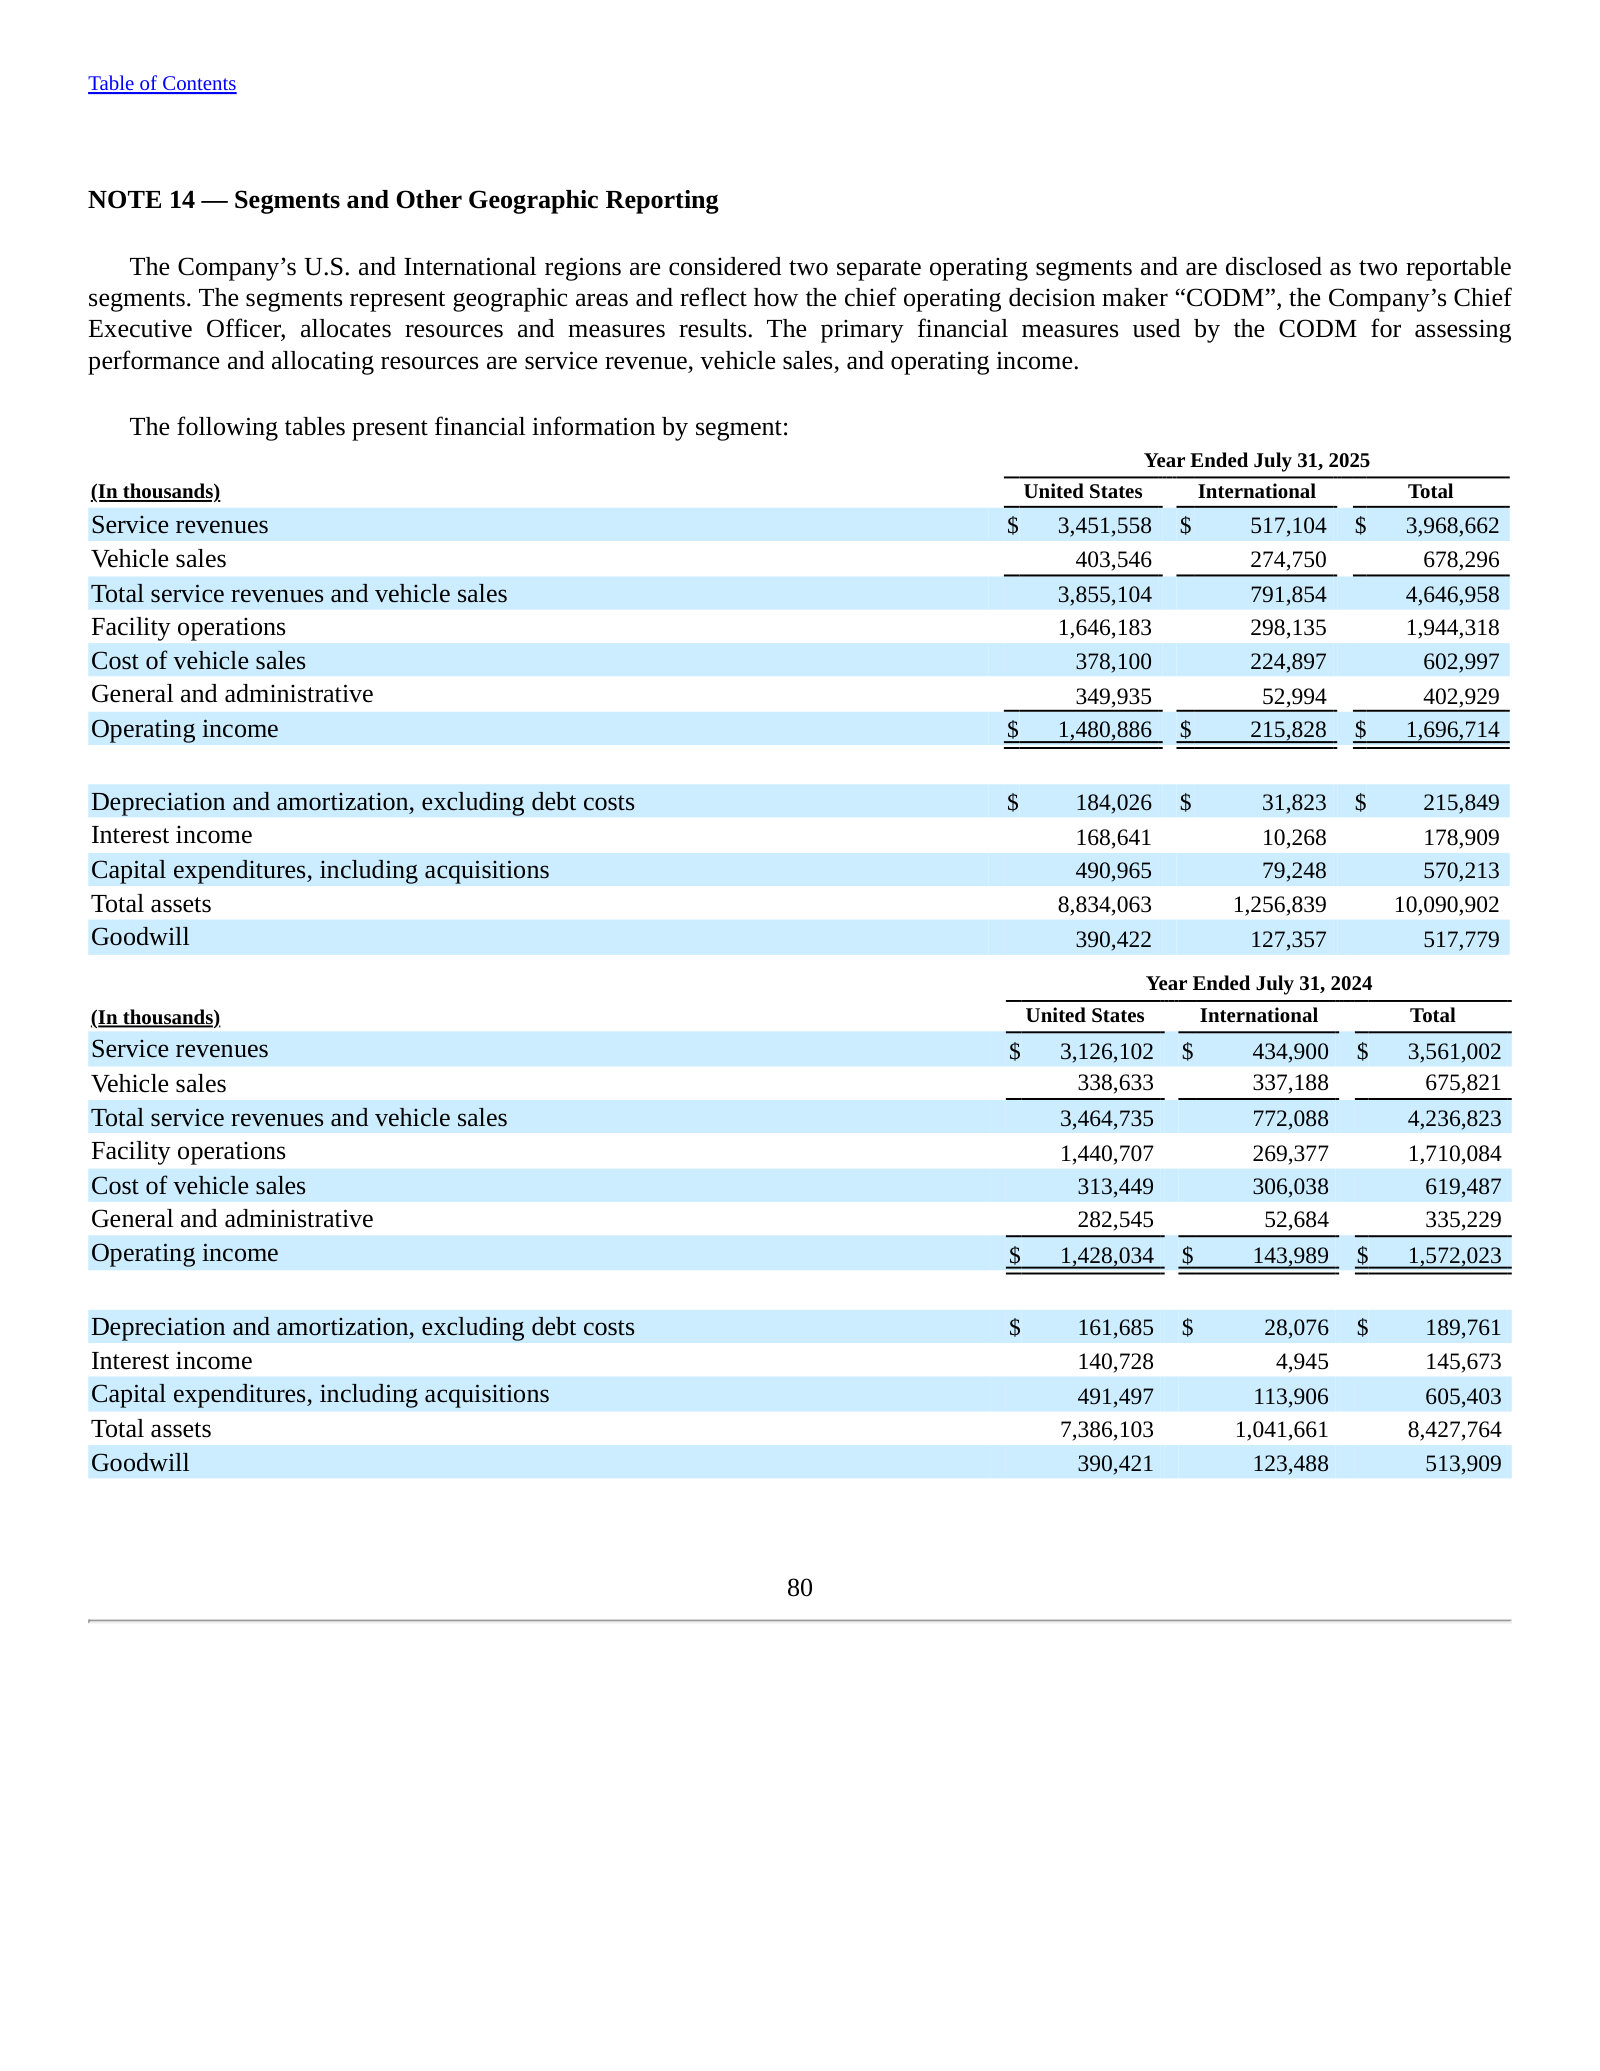
NOTE 14 — Segments and Other Geographic Reporting — p. 128 · Read the full section →
Two segments, U.S. and International, with the split of revenue, operating income, capex and assets that shows where the profit sits.
More annual reports
Copart, Inc. — FY2024 Annual Report (Form 10-K) — FY2024 (year ended July 31, 2024) · 129 pages · Prior year: Purple Wave acquisition and the run-up to FY2025's record revenue and margin. · Open →
Copart, Inc. — FY2023 Annual Report (Form 10-K) — FY2023 (year ended July 31, 2023) · 119 pages · Peak operating margin year (39%) — a useful baseline for the later cost-ratio drift. · Open →
Copart, Inc. — FY2022 Annual Report (Form 10-K) — FY2022 (year ended July 31, 2022) · 129 pages · Hills Motors (U.K. green-parts) acquisition and the used-car price spike that lifted salvage values. · Open →
Copart, Inc. — FY2021 Annual Report (Form 10-K) — FY2021 (year ended July 31, 2021) · 140 pages · Post-pandemic rebound edition — earliest of the five, for tracing the multi-year growth trajectory. · Open →